For the buyer of a small, 10-15 member consulting firm, the value lies in existing customer contracts, goodwill generated by the horizontal or vertical integration the acquisition represents, and in some cases- most importantly- in the non-compete agreements signed by key employees or management not retained with the firm after the sale.
Non-compete agreements are designed to prevent competition which can lead to damaging consequences if the acquirer were to lose key customer(s) in the process. Valuing the non-compete is done using diligent analysis of each of the following:
market share of the target firm, outlook for its operations over the next 1 year at minimum and last 2 years of cash flow & quality of earnings analysis
any recent or pending liabilities of the target firm including legal fees & settlement payments
estimated loss of operating cash flows, profits, etc resulting from the competition
discounted value of the profits lost
loss of customer references which is a top prize for most consulting firms
short and long-term implications of loss of market share to a key competitor that chooses to employ the former employees of the target firm
The probable damages listed above that competition would cause, combined with the likelihood of competition from each key employee, and the time duration for which the company will remain vulnerable can be used to create the noncompete agreement itself, and to determine the monetary distributions under the agreement.
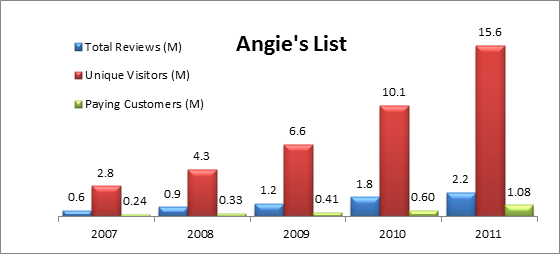
The following graphic shows the trend of user reviews posted on Yelp.com to the number of unique visitors the site received each year from 2007 to 2011. Yelp demonstrated increasingly efficient network effects starting in 2010 and 2011, also the year it went IPO.
Angie’s List has seen more ROI per subscriber and far more paying subscribers than Yelp, primarily due to the “utility” aspect of the website. It gives paying users easy access to service providers and customer reviews. One reason is that Angie’s List customers mostly include individuals surfing the internet looking for reliable service providers, whereas Yelp’s customers are local businesses who have other options to promote their business.
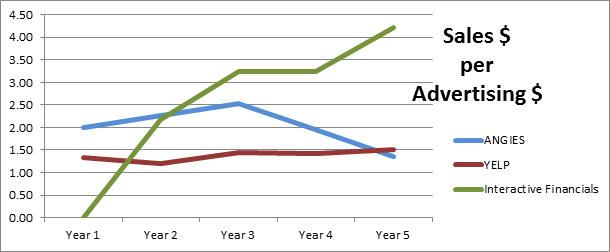
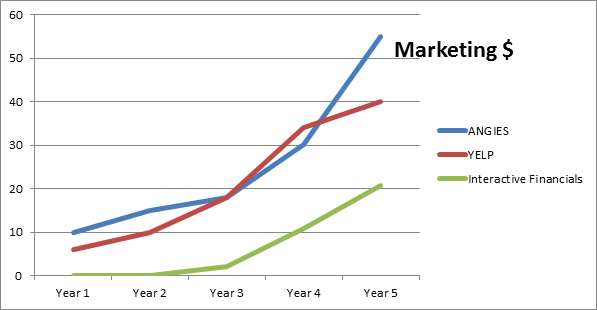
Angie’s List was able to generate $1.95 in sales for each marketing dollar spent whereas Yelp generated $1.41 per marketing $ in 2010. In 2011 the tables turned and Yelp came in with a $1.50 ROI with Angie’s List finishing close with $1.36. It is worth noting that the advertising dollars spent per unique visitor to either website increased by 12% YOY.
The ROI from online advertising expenditures is plotted over a 5-year period for the comparable firms along with Interactive Financial’s projected ROI over the next 5-year period. This chart serves its purpose for comparative purposes only because the market conditions have changed since 2007, and the 2012-2016 timeframe looks to attract more new visitors to “utility” web sites such as Angie’s List (services), Yelp (business reviews) and Interactive Financials (financial data errors).
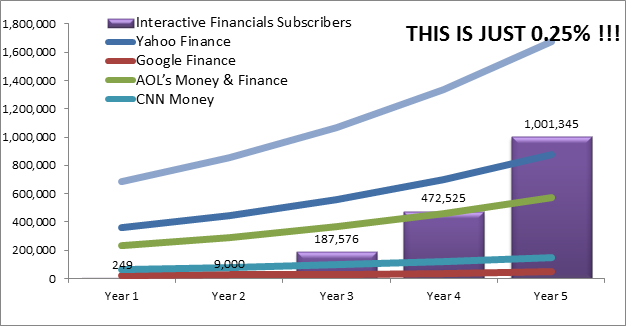
The sales projection for our startup, Interactive Financials, looks attainable given that just 0.25% of the unique visitor population is considered “converted” to paying status.
First off, a quick mention of the professors who were brave enough to risk “teaching” us entrepreneurship! Taking the entrepreneurship class with Prof. Naeem Zafar and Prof. Safwan Shah was really cool, and easily the most memorable experience at HBS. Prof. Naeem is a fun personality who knows everything about the startup world and is mentor to some very successful, and some not so, entrepreneurs in the valley. Prof. Safwan, who I personally admire, likes to live at the higher altitudes teaching us the nuances of “being free to express” our true colors if you will. The two really put on a show at Haas.
What follows in the rest of this post is the executive summary of a startup that four other members in my team helped create. In a future post I’ll detail the advertising strategy we used using Yelp and Angie’s list as models very similar to our own.
1. Company and Vision
Interactive Financials is a SaaS company that increases the reliability of the financial data used by individual investors. In order to identify the most reliable data, we examine several data sources ranging from free to up to $2,000 per month, and rank the freely available content at the most granular level with our proprietary algorithms. Our plugin displays in real time the result of the quality check for Yahoo! and Google Finance and points individual investors to the most reliable free website for only $10/month. Once we build the skills in cross checking multiple data sources to improve data quality for individual investors, we will develop more sophisticated tools that address the data issues faced by professional investors, such as traders and brokers.
2. Fundamental Pain Addressed
Free financial websites are not particularly reliable when used independently. Lack of standardized data collection system and auditing process make individual investors vulnerable to data errors. Individual investors need accurate data to make financial decisions, but currently they can’t rely on a single source without being exposed to several data issues. We don’t just find you data points; we find you the most accurate data points. Interactive Financials will direct individual investors to the most reliable freely available data in seconds. No more worries about the honesty of your data.
3. Products and Technology
Interactive Financials is a data processing center with sophisticated analytics capabilities that meets the end user via simple plugins, which will be offered for the major Internet Browsers as well as Excel. These plugins will play the role of a bridge between the free financial websites and individual investors. Our plugins will communicate with our datacenter, which is refreshed multiple times a day, in order to determine what the most reliable source to get the data an investor is currently looking at is. Imagine one is checking the stock price of Apple in Google Finance and the price on Oct 2nd, 2012 is wrong. If she had the Interactive Financials plugin, she would see a warning label next to the price column with a ranked list of alternative sources that had more reliable price data for that specific day.
4. Competitive Advantage
Our research suggests a complete lack of competition in this space, although there is a clear need for affordable reliable data. During our interview with Karolina Netolicka, Product Manager of Google Finance, she acknowledged the frequent data errors in her product and admitted that neither Google has the priority to fix these data errors nor any other company offers potential solutions to it. Both our market research and interview with Karoline suggests that Interactive Financials will be operating in a niche market and can secure a solid customer base by utilizing first mover advantage.
5. Market Analysis
According to our survey, 58% of individual investors view data quality as “Very important” (the highest rating), and 70% have experienced or foresee bad consequences caused by incorrect data. Interactive Financials’ goal is to bring data integrity to individual investors, who heavily rely on freely available data to make financial decision. Yahoo! and Google Finance dominate the free financial data source market with over 50 million unique users. Our core target group is 7.5 million “Technical” investors, who are aware of data issues and directly suffer from them. Based on our market research, we foresee 10% of “Technical” investors as part of our customer base at the end of the 5th year.
6. Sales Strategy
Interactive Financials will pursue a B2C model by giving access to its database to individual investors using a monthly subscription model and via plugins for popular software. We will be focusing on targeted online advertisement to acquire most of our customer base. Based on our forecasts, we will be serving close to a million customers in year 5. In addition to direct sales, we will be working with popular financial sites, such as Seeking Alpha, to raise awareness about our product and partner with Linnsoft, and companies similar to it, to expand our customer base. Interactive Financial also has several growth opportunities such as building advanced products for professional investors, opening to international markets, and making plugins compatible with other websites.
7. Financials and Other Key Metrics
Costs- The main expenses categories are data ($800k/year), staff ($3M/year), and customer acquisition ($20/customer).
Revenues- After 5 years of operation, Interactive Financials could potentially generate $80M in sales reaching the one million customer mark in year 6.
Necessary Funding- Interactive Financials seeks $1M in convertible debt @ 8%/year, with a premium at conversion during Series A at 125%. After 12 months, Series A funding will require $7M, which will allow Interactive Financials to operate for the remaining 27 months after which the company will be profitable.
A few lessons from pricing strategy analyses completed in the past few months..
Price Leadership requires desirable ‘price followership’ to work, however, the price leader must demonstrate commitment to maintain value-driven pricing and invest in the growing the market to increase its overall profitability
Companies should be vigilant of threats arising not only from direct competitors but also indirect competitors who might shrink the market or even destroy it. These threats can either be attacked directly, or the threat can be leveraged in a way to grow the target market by in-your-face advertising and presenting the defecting customers with a better alternative bundled as a “loss”
Also part of good Price Leadership is to know when the time is right and how best to move prices higher to raise the “level of the sea”[1] and contribute to increased industry profitability. A way to do this is to increase advertising in a market to protect it from ceding ground to an alternative product that performs a similar function but differently.
Pricing strategically is essential to success of the product as well as the market for the product. It requires an understanding of how products and services create value for customers, alter competitive dynamics and other relevant players in the industry
Segmenting our customers is vital – not all customers are desirable and it is vital to know how our value drivers map to our target customer segment needs
Generally, it is always better to align price with value delivered – value based pricing – rather than just following a cost plus pricing methodology
Price elasticity increases as companies capture more and more of the customer surplus for themselves. This knowledge is critical to implementing phased price increases so as not to increase prices to a point where demand drops to undesirable levels
Excessive product variety tends to reduce the Social Surplus in a variety of ways: causes customer confusion, increases manufacturing complexity and causes market decline over time because resources are not diverted to developing other market categories
Fences can be an effective way to create a price structure to align price with value and cost to serve
Creating versions of our product and sometimes even introducing flankers can be an effective profit generation and market growth strategy
Price setting, and more generally Price Leadership, are powerful signaling tools to our competitors
The Pricing problem is a “framing” problem. Buyers can frame transactions in ways the marketers of the product never intended, so it is imperative for Marketing managers to think about how customers frame their “gains” and “losses” so that the product can be positioned as an opportunity cost, or “gain” in certain situations and as a “loss” such as a volume discount, in other situations
A ‘price leader’ can often times benefit from ‘letting’ the competitor lead, relinquish the leadership role and become a good Price Follower– one way to solve the prisoner’s dilemma
[1] “The Price Advantage”, Marn, Roegner, Zawada by Wiley Finance: Pages 79.
In this post I will detail the business model innovation analysis I did for a startup founded by Yaron Samid- BillGuard. This assessment of BillGuard’s current strategy was conducted using the tools and concepts from MBA295M, Business Model Innovation and Entrepreneurial Strategy taught by the mercurial Prof. David Charron, a successful entrepreneur in his own right. The goal of this analysis is to project a true picture of firm offerings, sources of sustainable competitive advantage, network effects, market conditions and fragmentation, competitive positioning, pricing strategy and recommendations to improve its business viability.
BillGuard is an early stage consumer finance protection startup. A description of BillGuard’s company and business model provides a common understanding of the central value proposition, as well as the company’s primary strengths and weaknesses. BillGuard detects fraudulent, deceptive and erroneous charges on credit and debit card bills. Users register for the service by linking their accounts to the BillGuard system, which scans all transactions and issues a warning to the user if suspicious transactions appear on the bill. The service is described as “people-powered antivirus”, due to the crowd-sourcing approach to detecting fraud or errors. A proprietary algorithm scans transactions previously submitted into the system by other users, monitors complaints on websites and social media sites like Twitter and Facebook, and analyzes individual transactions for factors such as location or merchant history. In a second step, BillGuard harnesses the knowledge of its customers. When the system detects questionable charges, it notifies the credit card holder and asks for it to be reviewed. If a transaction is disputed, the algorithm records it as such and warns other credit card holders who have the same or similar charges. As of October 2012 BillGuard claimed to have identified $1M in unwanted charges for their customers. It is hard to justify this claim because it can be safely assumed that most savvy users of the internet do not have much to complain about in their card statements. There are, however, certain segments of credit card users like the very young and the very old who do not exercise scrutiny in conducting transactions online. These segments are good sources for BillGuard to source fraudulent transactions from thereby adding to its internal database of fraudulent merchants.
The service is also available for banks as white label integration into existing infrastructure. Alongside fraud monitoring and detection, BillGuard offers resolution management for disputed transaction, cutting down the bank’s processing costs and increasing convenience for customers. The company has declared that their roadmap includes expanding their crowd-sourced complaint detection platform to other services and payment providers, such as cell phone bills and e-payment solutions.
BillGuard was founded in April 2010, and launched their service to the public at Techcrunch Disrupt in May 2011, where it ranked second in the StartUp Battle. They earned a lot of attention in mainstream and tech media such as ABC News, Wall Street Journal, NY Times and Wired Magazine, and also received a number of awards by financial services organizations.
Two months after founding the company, BillGuard raised a $3M Series A round from SV Angels (Ron Conway), Bessemer Venture Partners and other investors. The second, $10M round closed in October 2011 which was raised by the previous financiers and added Saul Klein and Eric Schmidt to the investor panel. For a company at this early stage (Series A 2 months after founding) and in this sector, both rounds were substantially above the average size of each respective round. The company currently has about 30 employees with offices in New York and Tel Aviv.
Yaron Samid, co-founder and CEO, is the driving force behind BillGuard. He is a three-time entrepreneur in the consumer tech sector and sits on a number of boards of technology start-ups. He previously co-founded Pando, a service with over 50 million users worldwide, and has experience in product marketing and product management. Raphael Ouzan, co-founder and CTO, leads the product and R&D office in Tel Aviv, and a team of data scientists, mathematicians and engineers. BillGuard’s advisory board is comprised senior experts in big-data, payments and financial services such as Tim O’Reilly and Scott Lofteseness, EVP at VISA.
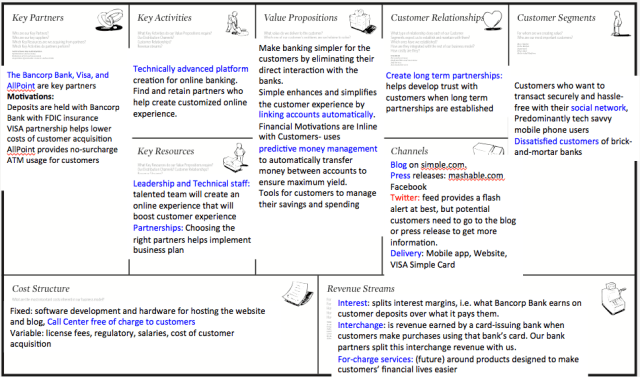
BillGuard’s Business Model
BillGuard has relationships with three customer groups: Consumers, Banks and Merchant.
Consumers- BillGuard scans the transaction activity of its users, running them through automated tests that identify suspicious charges. BillGuard also checks consumer complaint websites and social media for mentions of the merchants and charges. BillGuard will identify misleading charges, billing errors, scams and fraud and notify users via email when attention is required. When users login to BillGuard, they can verify any questionable transactions. If they find a charge they want to dispute, they can submit the charge to BillGuard’s Transaction Resolution Center, and BillGuard will contact the merchant on the user’s behalf to resolve the dispute directly. Any user activity is used by BillGuard to help identify unwanted charges on other user’s accounts. BillGuard for consumers is a fermium model. It is free for up to 3 cards. BillGuard Family protects 10 cards for $79 per year. BillGuard also provides a Business Plan, though pricing is not made public.
Banks- BillGuard provides an integrated solution for online cardholder resolution management and card protection systems. A bank can elect to offer BillGuard bill monitoring to its consumers, using BillGuard’s complaint and transaction analytics to identify unwanted charges, and also manage the consumer inquiry and dispute process. Banks benefit from integrating with BillGuard by improving their quality of service while lowering their inquiry and dispute processing costs.
Merchants- When a consumer interacts with a transaction through BillGuard, the service maintains a record and creates metadata around the transaction so other users can understand why each transaction appears. When consumers choose to dispute a charge, BillGuard contacts the merchant directly and gives the merchant the opportunity to resolve the complaint without going through the banks, which is usually very costly. Merchants get a consolidated view of what other consumers are saying about them, and a rating of their transactions by BillGuard users.
Value Proposition
The central idea of BillGuard started when a friend of the founder, Yaron Samid, called him to inform him of a fraudulent charge that he had received. Samid would never have found this charge himself – like 90% of Americans, he rarely looks at his statements. But it only takes a small and active minority to identify these charges for everyone. Samid realized that unwanted charges could be identified in the same way spam was finally controlled by email companies – by asking users to flag it. This is happening already –10,000 billing complaints are pouring into bank and credit card call centers every day, plus millions more post complaints online to the Better Business Bureau, Yelp, and social media. According to BillGuard, Americans will lose an average $300 per year on hidden charges, billing errors, and forgotten subscriptions. An estimated $7B will be lost this year due to fraud, though banks will only catch one third. The idea they are banking on is that users are interested in receiving alerts whenever someone else reported a suspicious charge that also appeared on your statements.
Revenue Streams
As a freemium business, BillGuard currently has one major source of revenue: consumers that upgrade to protect more than 3 credit or debit cards at a price of $79 per year. They also expect to collect SaaS license fees for bank or credit card companies that integrate BillGuard with their billing system. The company has not publically stated any corporate partners at this stage. BillGuard has also indicated a desire to charge merchants for the right to display the BillGuard logo on their site, but no public statements have identified any merchants paying for this service.
Analysis of the BillGuard Business Model
Competitive Landscape
The market for fraud detection is crowded with several B2B players. Memento Security offers a portfolio of fraud detection solutions for checks, ACH/wire and credit card fraud detection. Accertify’s Interceptas platform provides a data-mining based solution to fraud-management. Iovation’s web-fraud detection platform is unique in the manner in which it uses device-recognition to detect and eliminate fraud. There are several customer segments each of the incumbents target, namely commercial enterprises that have a heavy online transactional component, banks who hold deposits and non-financial institutions that need data compliance and risk management solutions. It is fragmented market with a large player, American Express owned Accertify, and several smaller players.
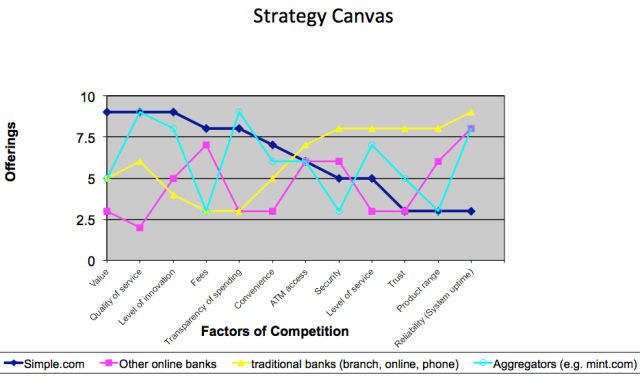
The incumbents sell products and services to banks and corporations that have a significant online transaction component to their businesses. Consumers do not pay directly to these providers. BillGuard, however, is the first B2C player in this market and charges $79/year for monitoring more than 3 credit cards. They also have an offering for businesses that is most likely priced based on WTP since this price is not published. Using this model, BillGuard is attempting to disrupt the business model of the incumbents, which relies on an enterprise-sell. BillGuard’s B2C approach coupled with its affordability as a fraud management platform might give it a wedge in the market but is not going to sustain substantial growth. Incumbents have key partnerships and technology value propositions that are hard to match and beat. BillGuard’s value proposition is strong to users but its ability to execute is relatively weak given that it relies heavily on crowd sourced content and does not rely on the risk metrics that are used by the incumbents to provide fraud detection. BillGuard’s competitive positioning is shown in the strategy canvas [Exhibit 1].
Contribution Margins
Memento has strong investigative capabilities from their partnerships with analytics providers such as IBM. Accertify partners with several analytics and risk-metrics provider such as Targus and ID-Analytics, and moreover they are a wholly owned subsidiary of American Express which gives them access to complaints data making their proposition even stronger. Over the long term BillGuard should look to strengthen its fraud-detection platform via a technology acquisition, such as that of Id-Analytics, which provides an enterprise-grade risk management and customer analytics platform.
Analysis of Consumer Pricing Plans
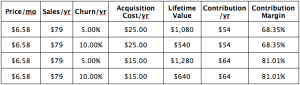
Using the simplistic customer lifetime value formula: [Monthly Sales] x [% contribution-margin / % churn-rate] we can compute the CLV for BillGuard’s customers. Assuming a $25 acquisition cost, a conservative 5% churn rate per year (the actual could be higher) the lifetime value of 1 customer is $1080, as shown below. I have modeled the CLV on churn rate and acquisition costs to present different CLVs that are possible.
The worst-case scenario is $540/customer with a churn rate of 10% and acquisition costs of $25, and $1280/customer if the churn rate is 5% and acquisition costs drop to $15. In order to return an ROI of 5x on investment ($13M) to their investors within 5 years, BillGuard needs 60,000 paying customers with a CLV of $1080 each, on average. If we assume 20% customers actually sign up for the $79 per year pricing plan, then the number of users of BillGuard needed are approximately 300,000 over 5 years. This equates to 60,000 paying customers of the service each year with some room for error.
However, it does not appear that BillGuard.com is registering 60,000 or more unique users each year. BillGuard.com has an Alexa rank of #323,884 which is better than Accertify.com and MementoSecurity.com but it lags way behind Visa.com and Mint.com. Mint.com offers credit card, bank account and investment asset aggregation dashboards and reporting capability to users, is owned by Intuit and is a fast growing company.
BillGuard receives 31,500[1] unique visitors monthly but it is hard to say if these website visitors actually sign up since BillGuard has not released such numbers publicly. Still it can be said that these are very low numbers when compared to Mint.com, which see 600,000 non-unique visitors each month. If we assume a 10% conversion rate, then approximately 3150 users will be signing per month, which equates to about 38,000 users per year. Hence it is probably hard for BillGuard.com to complete a 5x return to their investors in 5 years. As such, the current pricing model and market entry strategy is not satisfactory.
BillGuard Estimated Web Traffic
Source: compete.com
Google Trends Mint.com vs. BillGuard.com
Source: google.com/trends
We recommend BillGuard change its pricing model to skim the market of the much more risk-averse customers who will have much higher WTP than the more risk-tolerant credit card users who will not want to pay more than $79 per year.
Scaling issues
As noted in the analysis above, BillGuard needs to acquire more customers quickly. A market-skimming price strategy needs to be followed for the customer segment that has a higher WTP, however, BillGuard cannot afford to ignore the low WTP customer segments as well. It has to balance profitability and growth but the focus must be growth. BillGuard must press the growth accelerator by doing more market research to identify and narrowly target the risk-tolerant segment.
The market for credit card fraud detection, fraud reporting and resolution is huge. In a B2C model, it is practically the entire population of the world that uses credit cards. This is not an overstatement because BillGuard’s sales pitch is exactly that: help credit card users detect hidden fees, spurious recurring charges assisted gladly by the rest of the credit-card user community. There is a strong network effect here that BillGuard can capitalize on if it is able to scale quickly while maintaining a healthy P&L.
The BJ Fogg Behavior Change suggests that BillGuard should be able to initiate consumer behavior change to use their service by using a trigger. Although not all consumers may be highly motivated to initiate using BillGuard’s service, it is extremely easy to do for any consumer that uses online banking at a major US bank, or has used Mint.com. BillGuard needs to determine what an appropriate and cost effective trigger should be to capture the attention of low motivation users.
In terms of transaction volume of credit card companies in the US, a quick lay of the land is presented here ranked on purchase volume:
Rank
Issuer
Purchase Volume ($B)
1
American Express
$460.69
2
Chase
$333.13
3
Bank of America
$237.51
4
Citibank
$192.48
5
Capital One
$98.34
6
Discover
$92.47
7
U.S. Bancorp
$73.57
8
Wells Fargo
$49.10
9
HSBC (now Capital One)
$30.64
10
Barclays
$29.80
11
USAA
$28.24
12
GE Money
$20.98
13
PNC
$14.19
14
Cabela’s WFB
$11.94
15
Target
$8.55
Table 1: Purchase volumes of credit card companies
Today, BillGuard is trying to be a generic credit-card fraud detection platform. There is no evidence, given the public sources of information available, of it partnering with any credit card provider listed in the table above to drive more customers of that company to its platform. When I2c Inc., a payment processing company, was not getting enough traction with the market leaders, it decided to pursue Discover Card to become the credit card company’s payment gateway. Discover Card was lagging behind Chase, American Express and Visa in market share and needed a strong value adding partnership with a payment platform to extend its customer reach while ensuring safety and security of online transactions. The situation was a win-win that has thrived since inception.
We recommend that over the short-term BillGuard explore opportunities to partner with credit card companies that do not have sophisticated fraud-detection and resolution capabilities of their own, and other companies that have significant purchase volumes, and hence a large potential to create more signups on BillGuard.com.
Business Model Strengths and Weaknesses
Strength – Value Proposition
The strengths of BillGuard’s business model are its value proposition and the scalability of their product. First, the offering to credit and debit card holders is absolutely unique—no other competitor offers a similar consumer facing product yet, giving Yaron and his team a 2 year head start. The service is easy to use, non-intrusive and provides an additional layer of security to card holder. The value proposition for their B2B customers is also very convincing. BillGuard can offer a significant reduction in cost through minimizing processing cost of dispute resolution, which primarily happens in costly call centers, by allowing credit card users to resolve bad charges directly with the merchant. They also offer a unique way to detecting fraudulent and erroneous chargers adding an extra layer of security to the banks infrastructure.
Strength – Market Trends
Second, the markets they address with their value propositions are very likely to grow over the foreseeable future though a greater popularity of card payments with merchants (this is the particularly the case in non-US market), growth of e-commerce and the rise of other non-cash payment methods (such as mobile payments, NFC, etc.). Further, the product on it’s own is very scalable. The quality of the service actually improves with an increasing number of uses reporting bad charges. As with most tech-startups, IT infrastructure has become very affordable which reduces costs of growing the business. Also, their system can be applied to other types of bills such as cell phone bills, opening up other long-term growth opportunities.
Weakness – Technology
BillGuard’s biggest weakness is the technology behind their service. The problem they solve, doesn’t seem to be hardest technical challenges, and certainly one that can be solved by other experience engineers in the enterprise security sector too. It’s not based on primary research, nor is the idea of “people-powered” a unique principle. Also, on their website, they claim that they own intellectual property that protects their competitive advantage—or at least have patents pending. This usually doesn’t create a high enough barrier to entry for competitors or prevent copy-cats from using the same principles of people-powered fraud protection. Some people even argue that filed patents provide competitors with a blue-print and inspiration on how to solve the same problem.
A further issue with the underlying technology is the network effect it relies on to deliver a reliable service. If we imagine a situation, in which a large credit card company such as Visa, offers a similar, crowd-sourced security feature, their significantly larger customer base, will create a product of much higher quality than BillGuard’s in a very short period of time. Assuming that these organizations manage to create incentives for their customers to flag unwanted charges, a in-house solutions seems to be a better alternative for large organizations.
Weakness – Revenue Stream
The second weakness of the business model we identified is the revenue stream. Currently, the service is offered for free to customers with less than 3 credit cards. BG only makes money of customer who sign up for a $79 annual subscription. We believe this way money that customers are willing to spend is left on the table. The issue here is that BG charges for monitoring of the cards, however this is not where the value is created for the customers. So rightfully, they offer it for free to most customers. When a bad charge is discovered the customers suddenly has much clearer willingness to pay. For example, a customer has only one card and only one bad charge of a few hundred dollars. Finding this charge is free for the cardholder, however presented with the discovery, most customers would be willing to pay for this service as share of the money they saved.
Assessment of their potential success
In order to assess their potential of BillGuard becoming a successful company, we need to understand the implications of the VC investments in this firm. The venture capitalist’s and the entrepreneur’s interests are now aligned, and both work towards the goal of creating an exit opportunity with the common goal to maximize returns. An exit could be either an IPO, an acquisition or a merger. The time horizon for reaching those goal is based on the lifecycle of the investment fund which ranges from 5 to 10 years from inception; for online tech companies it’s usually at the lower end of this spectrum. In order to make an exit possible, revenues in the range of $50M-$100M should be reached within this time frame. Based on the information that is publicly available, it’s not possible to make a reasonable estimate on how well BillGuard is currently performing against these goals and if they are in track to liquidity.
Looking at the traction BillGuard gained with consumer, the figures are not convincing. In the last 12 month, the services saved $500,000 in bad charges (according to their website and other sources), which translates into less than 2,000 customers if we assume that an average customer loses $300 per year in bad charges and if we assume BillGuard would catch all these. Even if more prudent, the number of total charges of just over $1M saved through BillGuard seems small for a 36 month old service, that is free for most users.
An explanation for this lack of traction might be a lack of understanding of the need and the resulting willingness to pay. Since 9 out of 10 credit or debit card owners don’t check their bills, people are not aware that bad charges are an issue. It only becomes apparent, in case of serious fraud, which usually is covered or at least detected by the card company. Resulting from that is the consumers inability to see the value in the service BillGuard provides – for a customer who doesn’t check their bills, it’s not possible to estimate how much money they would save, which helps establish their willingness to pay. Although BillGuard identified a need and has a compelling value proposition, they have struggled to find their product-market fit.
A further concern regarding BG’s potential for success is the competitive landscape that they face with their B2B offering. Transaction security is amongst the top priorities of financial institutions and a growing billion-dollar market. As outlined in the analysis above, the competition in this industry is fierce, with specialized companies that have a significant market experience, highly skilled staff and a broad range of product and service tailored for this type of customer. It seems unlikely for BillGuard to take a significant share of that market, considering the high requirements for reliability, accuracy and customization in that industry. Further, customer acquisition is even more challenging at that scale.
On the other hand, BillGuard’s team, investors and advisors, suggest a much more positive outlook. The founding team can look back on previous successes, the investors are amongst the most prestigious in Silicon Valley and the advisors provide a broad knowledge as well an industry network. Considering that BillGuard managed to raise a substantial second round 16 months after Series A, it’s fair to assume that the company is on a convincing road to success. They also managed to build a reasonable buzz in press and amongst industry organization.
To come to a conclusion, we’re not too optimistic of the company’s chances of turning into an exitable business that yields satisfactory returns for their investors due to the reasons outlined above. However, the company is still young and has enough time and resources to improve their product for the B2B space, and build up traction with card holders.
Below are some specific recommendations that the company should implement in order to be successful.
Focus on Customer Acquisition
In the balance between growth and profitability, BillGuard needs to focus squarely on growth. At this stage, the company needs to be focused on acquisition. Big banks seem like an attractive target, but BillGuard does not complement their business model. Banks and credit card companies will quickly embrace technologies and features that increase consumer-spending rates, like mobile payments and rewards. BillGuard is a feature that banks could build themselves but have little incentive to do so. So BillGuard must focus on acquiring consumers itself, and grow organically and attempt to become a de facto industry standard.
To do so, BillGuard must focus on reducing any friction to customer acquisition. It must understand viral levers like network effects, and introduce viral features to its products. This is critical to get the acquisition costs down for the freemium model. It must also understand the BJ Fogg behavior change model, and identify triggers that will lead to consumer adoption.
BillGuard needs to determine how to create value for the everyday consumer, including the 75% of consumers who likely will never have an unwanted charge disputed and resolved through the product. This could be creating a greater sense of security or peace of mind for a consumer’s personal finances, helping consumers “fish for money” through insights into their transaction characteristics or other value that can be derived through channel partners. BillGuard needs to make consumers care about protecting their cards, in a more substantial way than they currently receive.
Revisit Pricing Strategy
A second fundamental change in BillGuard’s business tactics we recommend is to come up with an different consumer pricing model. As described in the weaknesses section, their current structure omits the willingness to pay by customers, once BG discovers bad charges and helps them to get their money back. We suggest a revenue model, that’s reflects the success-rate of their service—BillGuard charges a share of the amount of a bad charge they discover. This kind of performance-based fee structure work well in many other B2B and B2C settings and also aligns the interest of BillGuard with the interests of their customers. Instead of charging for a service that doesn’t create any tangible benefit for most of the time, our recommended pricing model captures value when value is created for the customer. Additionally, it signals that BG has confidence in their own system and also presents a more transparent pricing model.
To further enhance the willingness to pay based on this pricing model, we recommend BG to implement features that go beyond discovery of erroneous charges and actually manage the process of disputing and recovering the charges.
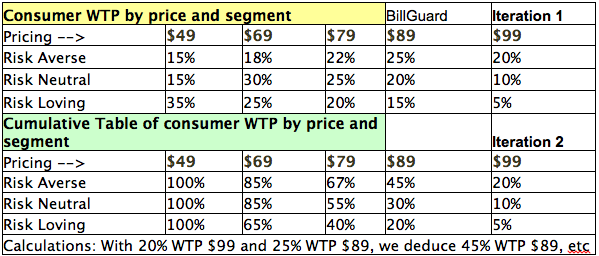
Along with the change in the pricing model, BillGuard should also look at it’s customer segmentation, identify those with a higher willingness to pay and understand how to create value for them. In particular, change the pricing model to skim the market of the much more risk-averse customers who will have much higher WTP than the more risk-tolerant credit card users who will not want to pay more than $79/yr. However, this is easier said than done. Extensive market research will be required to truly understand the motivations of credit card users and several iterations of analysis will need to be done to isolate risk-averse, risk-neutral and risk-tolerant segments. A WTP matrix should be constructed and segment-specific total revenues should be calculated at different price points. Further, this hypothesis should be tested in the market using several popular techniques such as surveys and focus groups. An example WTP matrix is presented here in Exhibit 2.
Create IP differentiation and protection
Third, we recommend they refocus on their technology. As outlined in the weaknesses section, the problem they solve currently is not a hard one, their IP is not strong enough to protect them from copycats, and potential new entrants can catch up quickly. First, the system needs to be more accurate and better in recognizing wrong charges. After having registered our own cards, BG found questionable charges that actually were correct and were made by reputable vendors. Also, currently the system hinge on power of the network of users. Since this is not a sustainable, long-term differentiator, we recommend broadening or improving other data sources that help with the detection of charges.
Plan for integrated, enterprise-ready technology
Over the long term we recommend BillGuard look to strengthen its fraud-detection platform via technology acquisition, such as that of Id-Analytics which provides an enterprise-grade risk management and customer analytics platform. However, chasing Id-Analytics or any of the other leading providers may not be a good idea since these entities already are in partnership with BillGuard’s competitors. Potential targets for acquisition are JanRain and LifeLock, both of which focus on providing bleeding-edge identity theft prevention technologies and would be a good complement to BillGuard’s credit-card fraud detection and prevention platform. Further, it would help BillGuard extend its platform to banks accounts, ACH/Wire protection and check monitoring.
Create Strategic Alliances
We recommend that over the short-term BillGuard beef up its technology and analytics platform. Having acquired this core competency, either through acquisition or building it themselves, BillGuard then needs to explore opportunities to partner with credit card companies that do not have sophisticated fraud-detection and resolution capabilities of their own. Credit card companies that have significant purchase volumes but without a sophisticated analytics platform will find value in partnering with BillGuard creating potential for increase traffic and paid usage at BillGuard.com.
US Bancorp and Discover Bank are good targets for alliance that BillGuard should explore. Discover, in particular, are known to be aggressive value seekers and partner with new market entrants more readily than do the other banks. An example cited earlier in this paper is Discover’s partnership with I2C payment systems to create value-added services such as transaction processing, stored-value card management and prepaid application services.
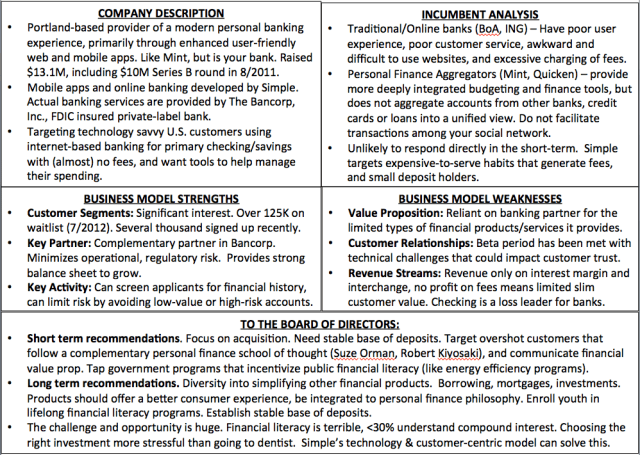
In this post I will show a quick fire way to analyze the business model of virtually any small company. Since I focused on startups in Prof. David Charon’s Business Model Innovation & Strategy course, here is an analysis I did for Simple Bank.
First off, sorry for the late late post on Zara. Got distracted with stuff.. but here goes.
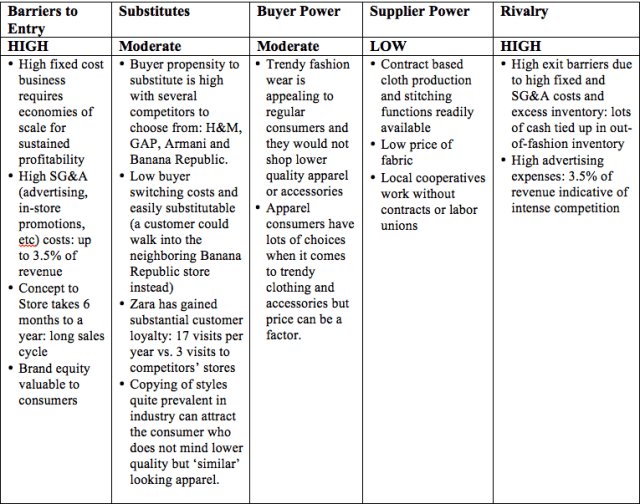
Overview of the determinants of industry profitability (Porter’s Five Forces Analysis)
Zara’s competitive position can be quickly summarized using the chart below, where it is seen that Zara has a dual advantage over its competitors: generates more top-line revenue (in 2008 it became the largest fashion retailer in the world surpassing GAP), maintains low cost manufacturing and distribution networks (goes from concept to store in 15 days on average, 10 to 12 times faster than closest rivals, H&M and GAP[1] respectively with a 17.4 factor-advantage over advertising costs[2]).
[1] H&M takes 3 to 5 months from creation to delivery: 5*30/15=10 factor advantage. GAP data given in case. [2] Industry average: 3.5% of revenue spent in advertising. Inditex spends 0.3%, 67% of this cost attributed to Zara. 3.5%/(0.3%*.67) = 17.4 factor advantage.
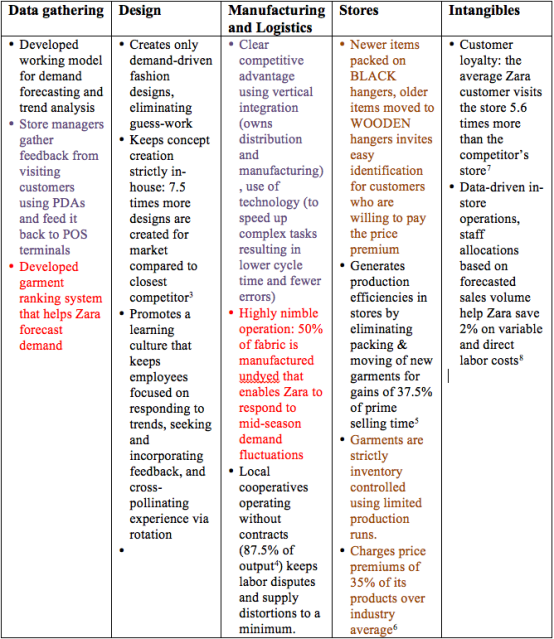
Competitive position & strategy
The strategic choices Zara has made and the competitive levers afforded to it by way of implementing these strategies is documented in the table below (the color-coded activities are mutually reinforcing):
[3] H&M creates 2000 to 4000 designs per year compared to 30000 designs by Zara at La Coruna, ‘The Cube’. [4] 1/8th of dollar volume is contracted out to Turkey and Asia. [5] Zara gains up to 3 hours of prime selling time over competitors, assuming an 8 hour window that translates to a 5/8=37.5% advantage vs. competitors. [6] Avg. industry markdown is 50% (=markdowns/net-sales), therefore about 50% of garments are NOT soles at full price. Zara sells 85% of its products at full price, and therefore generates maximum margins on 35% more of its products than competitors do.[7] Customer visits: Zara is 17 times versus 3 times a competitor. [8] The case mentions 2% of work hours, which would- for hourly employees, it is assumed- translate to 2% on variable and direct labor costs
Extent to which activities mutually reinforce each other
Store managers using PDA data and relaying data into POS terminals
Using technology to handle complexity and minimize errors
These two reinforce each other to a very high degree. Technology is used pervasively by Zara, both in stores and in the distribution center at La Coruna (and Zaragoza)
Inventory control using limited production runs
Hanger signaling system lets savvy customers identify newer apparel
These two work hand-in-hand because a savvy customer knows the item in a black hanger wont last that long, and is willing to pay the full price to look differentiated
Garment ranking system and demand forecasting using customer feedback
50% of production fabric is received undyed at La Coruna
Receiving undyed fabric lets Zara control for demand fluctuations in the short-term
Zara is better able to respond to changing local and national tastes by receiving undyed material, and then working with local cooperatives to stitch together customizations identified using the POS customer data collected in stores.
Potential for conflicted choices
Manufacturing in-house: There is inherently some risk in producing 40% of total fabric and 60% of merchandise in-house at La Coruna. Zara is exposed to demand fluctuations, supply-side distortions like oil price hikes that could derail the carefully syndicated and orchestrated logistics. However, Zara manages to stay ahead by using forecasting techniques, and incorporating customer feedback into creating those forecasts.
Ironing clothes in advances, paying extra to pack them in hangers imposes some cost to Zara, and is a sunk cost if the garments are not sold. However, Zara controls for this outcome by limiting production and cycling through inventory every 2 weeks or so.
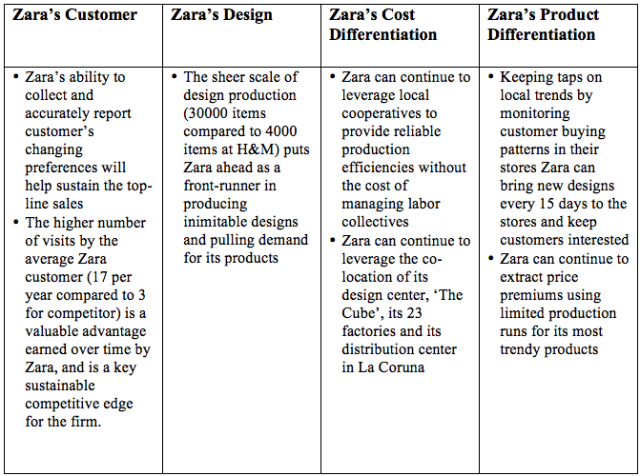
Sustainability of Zara’s apparent competitive advantage
The following factors contribute to the sustainability of competitive advantage:
Vertical integration rationale
Choosing a high degree of vertical integration has several advantages for Zara: it helps to correct market imperfections such as eccentric consumer behavior (e.g. switching patterns driven by Hollywood releases), helps to create levers for Zara to pull (or regulate) in order to manage inventory in times of demand and supply distortions and helps Zara extract maximum margins on its products. The following table details these and some other advantages of vertical integration for Zara.
It seemed intuitive to me that if I had a lot invested in creating a product or service, I would want to keep prices high for as long as possible. However, if I entered a market with gaining market share as a primary goal, then (under some conditions) I would enter with low prices, and penetrate the market. But if an incumbent matches my lower price, what would I do?
Before taking microeconomics last year and now Pricing with Prof. Wasim Azhar, I would have not lowered my price even further to keep alive the dream of breaking-even some day on all of my investment. However, the notion of ‘sunk’ costs would dictate that I consider lowering prices even further to attain my primary goal of gaining market share. The large sunk costs have created an ‘exit barrier’ for me. A price war would result, one that would hurt both players and eventually the market itself.
How should you price a product in two different market segments when you are given the segment size, willingness to pay and segment development costs? How should you price two products in these two segments when the WTP for these two products are different? The first two sessions of class today were spent answering these two questions using the Salesoft, Cambridge and Keurig study cases.
Product variety and Pricing
Say, the WTP is lower in a second segment compared to the first segment. Naturally, price would have to be lowered when entering the new segment. What is the impact, called the dilution effect, of marketing the product in the second segment? Would it be worthwhile entering the new segment for the firm? The following analysis will determine the net impact to cash flows.
First, lets determine the cash flow from segment1 alone. We begin by calculating the unit contribution margin using the following step: Unit Contribution Margin (UCM) = [(selling price * realized price) – unit variable cost].The net cash flow in a segment will be: Net Cash Flow = UCM * segment size (Q) – Costs of segment development – Fixed Costs (FC)
The net cash flow from segment 1 is CF1: UCM1*Q1 – cost-of-segment1-development
Now, lets examine what happens when the product is offered at a lower price to segment2.
The stimulation effect of the new segment is: UCM2 *Q2 – cost-of-segment2-development -FC
Dilution effect of lowering price in segment-1 is: (UCM1 – UCM2) * Q1 (the loss of profit when the first segment notices lower price and purchases)
The net cash flow, CF2 is: (UCM2*Q2 – cost-of-segment2-development -FC) – (UCM1 – UCM2) * Q1
Two-Part Pricing
Here I demonstrate two-part pricing first by calculating a single optimal price using a simple price-demand relation, price elasticity and the Lerner rule. Next, I examine two different segments with different price elasticities and determine different prices for each segment. The data is taken from the Keurig case.
Single price:
P: Price
Q: Demand
Price-Demand function
P
Q
Marginal Cost (MC)
199
6
200
149
9
99
31
Q=aP+b
6=199a+b
9=149a+b
P=250
this is outside the boundary (99,199) and therefore nobody will buy at 250- the segment has not been tested at this price
Lerner rule
optimal price = n/(n+1) * MC
n = price elasticity
Price elasticity: relative change in quantity by relative change in price, expressed in %
delta-q/q
50.00%
delta-p/p
-25.13%
elasticity
-1.99
Higher the number here, the more sensitive it is to price. Demand shoots up when price drops
By lerner rule:
$402.02
if price elasticity is -2
$300.00
if price elasticity is -3
Two-part pricing for 1-cup/day drinkers and 2-cups or more/day drinkers:
Average Demand from both segments
P
Q
Marginal Cost (cents)
0.55
43.8
25
0.4
69.5
delta-q/q
-58.68%
delta-p/p
27.27%
elasticity
-2.15
CENTS
By lerner rule
46.71
price elasticity is -2.15
1 CUP
P
Q
Marginal Cost (cents)
0.55
5.1
25
0.5
16.7
delta-q/q
-227.45%
delta-p/p
9.09%
elasticity
-25.02
CENTS
By lerner rule
26.04
Cents per cup
2 CUPS or MORE
P
Q
Marginal Cost (cents)
0.52
30.7
25
0.42
41.5
delta-q/q
-35.18%
delta-p/p
19.23%
elasticity
-1.83
CENTS
By lerner rule
55.15
Cents per cup
This is two part pricing.
Now, lets model the Profit computation in terms of the cost of brewing system and the profits from selling the cups.
BREWER only profit = (P-brewer – Cost-brewer)*Q-brewer
We can rewrite this as profit = (P-brewer – (Cost-brewer – profit-cups))*Q-brewer
Notice, how this view of the Profit shows us the DISCOUNT we just applied to the cost of manufacturing the brewer simply by factoring in the profits generated from selling the cups.
Now, we can use Lerner rule: P-optimal = n/(n+1) (Cost-brewer – profit-cups)
Here, Marginal Cost is (Cost-brewer – profit-cups).
Using the brewer price elasticity (from the case) of 3, we get P-optimal= $186.00 FROM (-3)/(-3+1) * (200 – 76) where 76 is the 5-year discounted (at 10%) cash flow of profits from cups. To see where 76 came from: For 2 cups priced at 50 cents a day, profit per year with royalty of 4 cents and 250 days = $20. OVer 5 years lifetime profit/brewer = $100, at 10% DCF, NPV = $76.
Lower the entry cost, make profits on ensuing purchases. This is a customer lock-in.