

-
Recent Posts
Archives
Categories
Meta
How does Rackspace, a hosting services provider, structure supplier contracts?
Suppliers might have a fixed cost per unit but this information is not public knowledge. Rackspace must assume the probability supplier is low cost is ‘p’ and ‘1-p’ is the probability of dealing with a high cost supplier. It might also assume that this ratio stays constant going forward. Without knowing the true costs of manufacturing server hardware, Rackspace is limited to making such a guess about costs.
If Rackspace had full knowledge of the costs, it could structure a cost-plus contract that allows for 10-15% profit margins for the suppliers. But cost-plus contracts create an incentive for suppliers to overstate costs and grab excess share of profits. And of course, without knowledge of the costs (suppliers won’t reveal), i.e., in the presence of asymmetric information, the hosting provider must optimize the difference between the value created by the suppliers for Rackspace and the fixed fees paid to the suppliers. It could structure two contracts: contract-low and contract-high.
Contract-L: supply us XL number of servers and we will pay you FL in fees.
Contract-H: supply us XH number of servers and we will pay you FH in fees.
The idea is to set XL, FL, XH and FH such that a low-cost supplier will find contract-L more profitable, and a high-cost supplier will find contract-H more profitable. The next step is to write expressions for the incentive-compatibility constraints to induce a low-cost supplier to select contract-L and a high-cost supplier to select contract-H. Define one participation constraint for each type of supplier and finally, assuming that each supplier chooses the contract designed for it, write the expression for Rackspace’s expected net benefit.
Now the problem is to maximize the expected net benefit which can be done using quadratic manipulation if your net benefit equation is of that type of course, or otherwise, use calculus: take a derivative over number-of-servers and set the derivative equal to zero to determine your optimal number of servers for contract-L, and contract-H.
I shall post a full calculation showing the incentive compatibility and participation constrains in a subsequent post.
Note on utility function
Accurate mechanism design requires the formulation of a mathematical model that shows the value created by the system of suppliers for Rackspace- its utility function. Correlation is a distant second choice. We could use linear regression over the total revenues generated year over year as a dependent variable and the number of servers, customers served as independent variables using the last forty-eight quarters of data. This approach reveals the correlation between number of customers and servers deployed and total sales for Rackspace. Of course, the net of sales and fees paid to hardware suppliers is the benefit that Rackspace will want to maximize.
A simpler way to estimate the utility function for Rackspace is to recognize the fact that indefinitely increasing capacity will not lead to indefinitely increasing sales. This is indeed the familiar “decreasing marginal utility” function wherein each unit of capacity added beyond sustainable market share will lead to lower and lower sales.
It is extremely difficult to establish exactly what the Rackspace utility function actually is. The most common utility functions are exponential, power, log and iso-elastic. Exponential utility is a good choice for a function that helps in the calculations based on its acceptance by academics “since calculating expected utility with an exponential utility function reduces to calculating the moment generating function of the random wealth distribution” as noted here: http://bit.ly/17r3Xi4.
Another choice for a utility function might be one derived directly from the cloud computing industry demand function. It is possible to simulate the demand function for the industry as a whole assuming Rackspace is a price-taking firm. Prices have stabilized in the cloud computing industry with no clear price leader so it might be a reasonable assumption.
This is the first of several posts on a qualitative metric, return on management (ROM), that can be used to assess if your firm’s strategy implementation is on track.
Why is it that a large percentage of the most reasonable, analysis-driven, implementable strategies never make it from concept to reality? The answer lies with managers themselves, or more specifically, with how managers direct their energy. Managerial energy is the most scarce resource of a firm as Robert Simons and Antonio Davila describe in a great article on the subject in Jan-Feb 1998 issue of the HBR. The authors argue that the classical business ratios for measuring a firm’s financial performance- return on equity, return on assets, return on sales, etc., may be useful but that none is designed to reflect strategy implementation.
Some will argue that the fruits of good strategy implementation will bear out in the financials, and be captured by the classical business ratios eventually. Eventually. That is the key time frame here because strategy is for long-term and waiting for the classical ratios to reflect strategy execution is not optimal. Plus the ratios do not give us a measure for payback from a firm’s scarcest resource: manager’s time and energy.
ROM is a rough estimate and not an exact percentage. It is expressed like other business ratios by an equation in which the output is directional, i.e., it is maximized by a high numerator and a low denominator:
(Productive organization energy released)/(Management time and attention invested)
By using the ratio, managers can calculate if their ROM is high, medium or low. The art is in knowing which congruence relations help to maximize the productivity of a firm. Earlier, I wrote about the Tushman and O’Reilly congruence-based testing methodology and that a firm’s achievement of vision stems from alignment of the following relations: strategy, task, people and culture. If managerial energy is misdirected or diffused over too many opportunities or if dissipated along any of the congruence relations, then even the best strategies stand little chance of being translated into real value.
Alignment among congruence relations is key to ensuring that this scarce resource that managerial energy is, gets directed to the right projects. Of course, it is not as easy as it sounds and in the high intensity competitive environment of today, it is extremely challenging to keep managerial focus straight and narrow. This is where the ROM metric comes in. It indicates how well managers have chosen among alternative paths of action to deploy resources optimally.
It answers the question: “Are you getting the maximum payback from every hour of the day that you invest in implementing your business’s strategy?”. The successful business entity will strive to have its managers focus on specific, crystal-clear strategic priorities only for the amount of time it takes to get results. The world is teeming with business opportunities but there are only so many hours in a day and only so many managers to go around. A high-ROM manager knows that firms thrive when their leaders, and those who work for them, are disciplined in their use of time and resources of the firm.
ROM helps measure clarity of purpose that transforms the firm’s energy into productive energy and takes strategy from inception to market.
This post is inspired by my ongoing analysis of Rackspace, an up and coming provider of managed and hybrid hosting services in the cloud computing industry. The content of this post is based on my observations gathered while attending technical and general sessions at IBM Pulse 2013. Here I will keep the technology focus limited to cloud computing, specifically, IBM’s offering, SmartCloud. It may be said that the general smarter cloud strategies used by IBM’s customers all over the world might not be optimal in the true sense, given their recent move to using OpenStack as the underlying platform, but the investment in cloud does indicate how committed IBM is to the SmartCloud product offering.
Any product or services strategy should seek to maximize the value from the entire value chain of a firm. IBM does this beautifully by demonstrating during the pre-sales efforts, clear value to the customer which includes assessing architectural fit and technology advantages coming directly from the cloud offering.
IBM’s offerings are SmartCloud Provisioning, the product and SmartCloud Enterprise, the service. They use OpenStack (i’ll blog about this in detail later) as the underlying technology platform. This post discusses IBM’s deployment of SmartCloud at China Unicom which is a state-owned telecom provider, ranked as the 3rd biggest mobile provider in the world. The client is a division of this company, called the Network Management division that owns 19 separate networks used to run the “kernel services” that provide network and application monitoring tools to the user and administration community.
The key challenge for IBM is to provide the VMs which host the kernel services in a way that provides maximum flexibility, security and scalability on 19 separate networks. Another design constraint is to separate internal traffic from external network traffic.
The architecture proposed is clearly very simple- host multiple VMs on several KVM hosts (Kernel-based Virtual Machine) to create a highly available platform for hosting the kernel services, a set of monitoring applications deemed business critical. Request mapping is automatically serviced using IP address resolution and vLAN mapping techniques enabled using smart networking techniques and the features provided by SmartCloud.
It is said by many that cloud is composed of three key architectural elements- compute, storage and network. The network is the key challenge because compute and storage are offered by the product but network is a solution component. Especially, because network components can differ from one VM node to another. There is also the problem of network traffic isolation wherein the internal traffic must be kept separate from external traffic.
The solution proposed includes 100% isolation of the network between host and VM, unique signatures for internal traffic, user authentication against an enterprise directory, user and group access control, and SSH password less keys that remain embedded in the linux VMs. The value and benefit to customer include self service portal which is shared between network administrators and end users, a flexible IaaS solution, adaptable and scalable multiple vLANs switching architecture and reliance on open source projects such as ZooKeeper to provide end point management. Then there is the nice add-on, P2P based socialized communication which entails running bots on each hypervisor node that communicate with bots on other nodes in order to ensure availability at all times. If one bot goes missing, the next available bot picks up its share of pending requests.
Credit for some content in this blog goes to Jeff Yang, who is the owner of the OpenIBM twitter feed at http://twitter.com/OpenIBM.
Apologies for not including architecture diagrams- I am writing this on the go.
Walter Elias Disney entered the entertainment industry when he and his brother, Roy started a studio in Hollywood. He had, by then, already experimented with animating characters using newer “cel” based technique which was better than the contemporary “cutout” based animations. His characters at Laugh-O-Gram studios had been extremely popular in Kansas City but he could not sustain the business due to extremely thin margins. In Hollywood, even though he lost rights to the Oswald character and many of his best animators, Ub Iwerks- the original designer of Oswald- never left his side. After losing the rights to Oswald, Disney felt the need to develop a new character to replace him, which was based on a mouse he had adopted as a pet while working in his Laugh-O-Gram studio in Kansas City. Ub Iwerks reworked the sketches made by Disney to make the character easier to animate although Mickey’s voice and personality were provided by Disney himself. They said that “Ub designed Mickey’s physical appearance, but Walt gave him his soul”. Disney enjoyed much success with cartoon characters through the 1940s but also expanded operations to full length cartoon feature films, and diversified into other media in the 1950s.
In the aftermath of World War II, Disney sought out new revenue streams such as creating training and educational cartoons for the government, re-releasing Snow White which accounted for significant portions of their revenue in 1944. This was an epiphany for the company and proved the everlasting popularity of their main characters. Disney had indeed established a brand and the magic lay in the characters which they could now leverage to diversify into complementary and some not-so complementary businesses.
After WWII, Disney started mixing live action and animation scenes in their full-length dramatic movies. Disney also created the Walt Disney Music Company to create the music for its productions which is still a great example of backward vertical integration. As Disney’s film successes ensued and profitability increased they created their own distribution company, Buena Vista Distribution, resulting in tremendous savings on distribution fees and giving us a great case study in forward vertical integration. With a strong share of market in the media business and now connected to a fairly efficient distribution network that they owned, Disney entered the TV market with Disneyland and the Mickey Mouse Club. The expansion to TV was a key corporate strategy that created substantial leverage for the company because it already had a captive audience by then. The TV market entry brought them renewed public attention, interest from influential investors that it used to garner momentum for the next big break- the Disneyland theme park. The theme park was a fundamental shift in how the entertainment industry operated until Disney came along and created a gateway for fun for all ages. Of course, with all this expansion came the problem of managing the portfolio of companies each strife with unique challenges.
Business Strategy
All companies must develop a set of criteria to identify business units that should be evaluated for divestiture. These criteria should include financial performance metrics, but must also consider cultural and strategic elements. We recommend Disney ask the following questions to help arrive at their decision. Are better alternatives available? Is the market opportunity large enough? Is this business a good strategic fit – is it aligned with our core values? How much money must be invested to make the business successful? Is the business profitable? Honest answers to these questions will uncover inconsistencies in the business model that may only be corrected by divesting business units.
Exhibit 2 shows a map of Disney’s key activities and demonstrates their connection to the core parts of Disney’s business, theme parks and animated movies. Much of Disney’s popularity is derived from the creation of animated characters and children’s films. Disney needs to divest from activities which don’t align with its core strategy of providing wholesome family entertainment. They risk brand dilution if they continue with businesses that contradict their wholesome corporate image.
Recommendations
1) Divest ABC/Media Broadcasting Studios – Financially, ABC is showing negative trends that make it a divestment consideration. From 1995 to 1997 (before and after purchase of ABC), ROE declined from 23% to 12%; while a decline in ROE can be expected from the additional debt ($9B) (Exhibit 1), the decrease in operating income is cause for concern. ABC Network provides limited, and potentially negative, synergy for Disney, which is overshadowed by the negative spillovers it generates. For example, the rising cost of sports programming, including a $9 billion increase to broadcast NFL games, has made the synergy less valuable. Although the merger of ABC and Disney’s Touchstone saved the company an estimated $50 million per year, it created a culture clash which impacted the overall effectiveness of the company and caused creative talent to leave. A company that strives on its ability to be creative and unique cannot afford such key losses. The merger also stifled ABC’s business potential by limiting favorable alliances since it could no longer partner with program developers like DreamWorks. ABC fell from top ranked before the merger to third place in 1997. In 1999, they jumped back to the first place riding on the back of one supremely successful show. However, it is doubtful this success can be sustained, and they would be wise to take advantage of the increased valuation provided by this one-hit wonder. ABC, in its current state, lacks a compelling financial or strategic value proposition, and should be divested.
2) Divest Miramax / Touchstone / Hollywood Pictures – The core value of Disney is its brand image for high quality mainstream, family entertainment. Disney has been extremely successful in selling this image to the public through its amusement parks and animated films. There is no strategic fit between Disney’s core and the type of movies that Miramax, Touchstone and Hollywood Pictures produce. Controversial productions like Pulp Fiction will hurt Disney’s image and competitive advantage. The potential profits that could come from a top movie are not worth the brand damage that may come with being associated with this non-core asset.
3) Divest Anaheim Sports – The Anaheim Mighty Ducks created positive synergies when Disney made sequels to The Mighty Ducks movie. However, this is not a synergy that could be sustained over the long term. Also, the team has become a financial burden to Disney. The same argument holds for the Angels. Although the sports franchises may provide positive synergies with ESPN Zone and the hotel onsite at Disneyland, it is doubtful that the financial losses incurred from running the teams will be worth the tradeoff.
Exhibit 1: Operating Income as a percentage of sales and Debt Equity composition

Exhibit 2: Disney’s Activity System

Cloud computing is a very competitive market with the main competition coming from AT&T, Verizon, CenturyLink (via acquisition of Qwest in 2010), Softlayer and British Telecom.
Key success factors for a provider of cloud computing services
a) Niche market
b) Installed customer base
c) Price parity
d) Quality of Service
e) Technological edge
Source: http://tinyurl.com/cozlk9j
RAX capabilities to deal with key success factors and risks in this industry
a) Niche market – Weak, because RAX provides services to any and all market segments that have “demand”. They have not selected any vertical market, or Software-as-a-Service or Infrastructure-as-a-Service application to excel in. Instead, Rackspace is riding its business on “the segment of the market that demands, and is willing to pay for, strong support and management services on top of raw computing services”.
b) Installed customer base – Weak, because RAX does not have the customer base or geographical co-location advantages AT&T, Equinix and CenturyLink have and who also happen to acquire and retain these customers through other non-cloud computing related value-added services- telecommunication for example.
c) Price parity – Strong. RAX cannot increase prices because that would lead to ceding the market to other global players who are eager to enter. The global competitors in the cloud computing space state that differentiation on cost is virtually impossible to achieve because hosting costs are almost at parity for all service providers in the cloud computing industry, as noted here http://tinyurl.com/blchqme. Until 12/2012, RAX had taken a price leader strategy but this was bound to backfire because most customers in this market are highly price sensitive. Rackspace would end up getting most of their sales revenues from fewer and fewer customers if they continued to keep prices high, albeit for more peripheral services. In 2013 they announced price decreases amounting to 33%, http://tinyurl.com/bccd3ua. This pricing decision indicates Rackspace has warmed up to the fact that pricing parity is critical for survival, after all.
d) Quality of Service – Strong, because RAX pride themselves on customer service. They use the net promoter score extensively to gauge customer sentiment and constantly improve their offerings to increase the score.
e) Technological edge – Neutral Strong. I am revising this parameter based on IBM’s stated intent of increasing adoption for OpenStack and the fact IBM has included it as the platform of choice for its initial SmartCloud offerings. By promoting an open-source cloud computing platform called OpenStack that HP also supports, RAX is hoping for an ecosystem of partners that will generate long term cost efficiencies resulting from not having to pay for proprietary platform upgrade and maintenance services. However, it remains to be seen if this strategy will entice enough enterprise customers who value the availability of pre-integrated, pre-tested, and validated integration with other enterprise-class systems, something that OpenStack will need continued support over the next half a decade to achieve. RAX also does not have an answer to Amazon’s capabilities such as performance estimates/guarantees and backup from-and-to cloud services and auto-scaling features as noted here, http://bit.ly/YBHJH3. From a storage standpoint, RAX only recently became a player when it reduced prices to compete with AWS (Amazon Web Services).
Drivers of Rackspace future sales
Customer awareness (installed customer base plus new customers), quality of service and technology edge are the main drivers of future sales. Clearly, Rackspace needs to develop strengths in retaining existing customers and also acquiring newer customers. They may be able to do this using their current strategic focus on the following (Rackspace competitive strategy):
1) provide excellent service,
2) maintain a singular focus on delivering-IT-services-over-the-internet,
3) use a portfolio approach to offering flexible cloud computing services- dedicated as well as public hosting- to customers,
4) use and promote OpenStack, an open-source cloud computing platform.
Rackspace claims to have created several sustainable competitive advantages by following a “differentiation” strategy based on providing above-average customer support as opposed to Amazon that uses a low-cost strategy and rely on automated support. The list of claimed sustainable competitive advantages include:
There are some weaknesses in these claimed sustainable competitive advantages:
Key drivers for forecasting RAX financial statements
In order to forecast financials for Rackspace we want to focus on the key sources of competitive advantage- Fanatical Support and Hybrid Hosting. These are the primary differentiators across multiple services offerings that will drive organic growth in installed base and create pricing power for Rackspace. Rackspace should be able to charge premiums for their dedicated cloud (or “managed hosting”) and “hybrid hosting” solutions keeping their profit margins high, as they increase investments in long term assets – servers in existing and new data centers. Amazon for example relies on higher asset turnover since it does not premium price its cloud services. What they lose in premium pricing, they make up for in sales volume.
Method to forecast sales for Rackspace
Rackspace has reported revenue history for each segment in its MD&A that provides information relating to breakdown of revenue increases for the current year into the portion relating to increases in server deployments and increase in customer base. Information for dedicated cloud (or “managed hosting”) and public cloud is provided, however, hybrid hosting is a new segment that Rackspace has not provided much insight into yet. We feel it will be necessary to forecast margins per customer for this new segment primarily because Rackspace will able to charge a premium for it. One way we could do this is to use public cloud pricing and add an arbitrary 10% margin necessary to cover costs emanating from providing the “flexibility” customers in this segment desire. We would then perform sensitivity analysis on the margin and base price to check if our assumptions lead to reasonable sales forecasts.
Starting out we can work with the data provided for dedicated and public cloud. At 172510 customers with 79805 servers deployed as of 12/31/11, we can estimate approximately 2.16 customers/server-deployed. This includes servers in both segments- dedicated cloud and public cloud. The average monthly revenue per server in 2010 was $11,824/servers-deployed- about $5474/customer and in 2011 it was $12,844/servers-deployed- which is about $5946/customer, an increase of 8.6%. This $sales/customer number needs to be disaggregated per segment to produce the $sales/customer-per-segment forecast.
These numbers are slightly inflated (greater by 8.6M or 0.8% of net revenue in 2011) because the US$ weakened in comparison to the British Pound. Before forecasting sales in future periods we would want to eliminate the foreign exchange effects as also the effects of any acquisitions that Rackspace were to make since these are one-time occurrences and do not reflect the “organic growth” portion of future sales. Adjusting for foreign exchange rate fluctuations, a more realistic historical growth of sales/customer is 7.8%.
We know that dedicated cloud sales grew 21% on average and public cloud grew 83% on average in 2010 and 2011. Since dedicated cloud is the higher margin offering for Rackspace it would be pertinent to determine the sales per customer in this segment.
We also know that growth in installed user base was .5% and 1% during the same period, or 0.75% on average that we could use as a crude forecasted growth in installed base. Of course, it would be far better to get the growth in installed base per segment – “dedicated cloud” and “public cloud” – separately. We could then multiply forecasted $/customer-per-segment by the forecasted growth in installed base-per-segment to get a projection for Sales. We would then add these projections to the projected sales of the new “hybrid hosting” segment to give us a total sales forecast.
We will also want to forecast expenses because Rackspace happens to be playing in a high fixed cost industry. Rackspace is enjoying economies of scale as demonstrated by the increasing sales per servers-deployed, however, there might be a limit the firm is approaching here and we would want to explore that.
From management literature (Tushman & O’Reilly), the congruence-based problem solving is a method to quickly and accurately identify the root cause of performance or opportunity gaps. In the context of security architecture, the congruence model can be applied to creating comprehensive security assessments for an organization. The model emphasizes analysis of the relationships among four core components of an organization (shown in the graphic below) also called the building blocks whose alignment relationships are the focus of congruent security architecture techniques. The goal is to leverage the relationships and interactions between those core components to reveal the underlying security posture of an organization. Each congruence relation is important in forming organizational diagnoses that help us understand the current state of security in the enterprise, and the causes of the vulnerabilities. Analyzing these relations tends to define the political map and how the players tend to navigate it. It helps identify organizational behaviors that are helpful, neutral or detrimental to the security architecture initiative. Analyzing the following three alignments using an appropriate “congruence questionnaire” is crucial to determining the security posture of the enterprise.
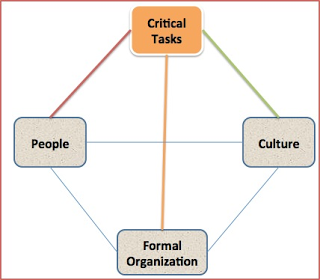
The Task and People Congruence Relation:
Identification goals: task-human resource inconsistencies that inhibit the ability to execute on security strategy.
The Task and Formal Organization Relation:
Identification goals: task-structure inconsistencies that inhibit necessary integration among SBUs, needed to deliver a comprehensive security solution.
The Task and Culture Relation:
This due-diligence analysis can help identify the need for managers and their teams to realign the formal structures, people processes and cultural aspects of their organization with the critical tasks necessary to achieve the overall security vision. Managers and their teams should learn from this process, and even re-initiate the process iteratively within their own SBUs if necessary.
Maximizing Profits When Demand is Semi-Log
We want to maximize profits, or (P-MC)*Q. Our demand function is given as ln(Q) = aP + b. To get Q from ln(Q), we use the exponential function (since e^ln(x) = x):
e^lnQ = e^(aP+b)
Plugging back into our profit function, we have:
Π =(P−MC)*Q
Π =(P−MC)* e^(aP+b)
To maximize profits, we take the derivative with respect to P and set it equal to zero.
∂/∂P(Π) = (P – MC) * a * e^(aP + b) + e^(aP + b) = (1 + aP – aMC) * e^(aP + b) = 0
(see note at end on how to calculate this derivative)
In order for the derivative to equal zero, either (1+ aP – aMC) or (eaP+b) must be zero. Since e x can never equal 0 for a real value of x, we know that it must be the first term, 1+ aP – aMC, that equals zero.
We can now solve for P: 1+aP−aMC =0 aP = aMC −1 P =MC− 1/a
Note on derivative: In order to see how the derivative is calculated, note the product rule for derivatives: (∂(g*h))/dx = (g* (∂h)/dx) + (h* ∂g/dx). In this case, g = (P-MC) and h = eaP+b. Note also that the derivate of e f(x) with respect to x is (df/dx) * e f(x).
Maximizing Profits When Demand is Linear
We want to maximize profits when Q=aP +b
Profit = (P-MC) (Q) = (P-MC) (aP+b)
Multiplying through and differentiating profit with respect to price and setting = 0 for the maxima , we get 2aP-aMC + b = 0.
Price sensitivities of demand differ depending on the product and the market. We can model our demand function to reflect how we think quantity responds to price. The following post will use calculus. If you don’t like calculus, the important thing to remember is that changes in the natural log approximately equal percentage changes. And so, by logging either quantity or price, you are saying that you think the relevant change for your purpose is a percentage change rather than a unit change. I’ll add another post to describe how to maximize profits when demand is linear or semilog.
Linear Model: Q = aP + b
To see the implications of the linear model, let’s take the derivative with respect to P.
dQ/dP = a dQ = a*dP
units change in Q = a*(units change in P)
In the linear model, a $1 change in price leads quantity to change by ‘a’ units, where ‘a’ is the slope of the demand curve. In other words, a $1 change in price gives the same absolute change in quantity regardless of the price level it is being measured.
Price Sensitivity = (dQ/Q/dP/P) = (P/Q)(dQ/dP) = (Pa)/Q = a(P/Q) which is not constant and varies over the demand curve depending upon the P, Q coordinates. Also Price sensitivity = (aP)/(aP +b) if we substitute aP+b for Q
Log-log model: ln(Q) = aln(P) + b
First let’s remember that: (d ln(Q))/dQ = 1/Q , and ln(Q) = dQ/Q = (change in Q)/Q = % change in Q if we take %
Now, if we differentiate the log-log model, we have: (d ln(Q))/(d ln(P)) = a d ln(Q) = a*d ln(P) dQ/Q = a * dP/( P) % change in Q = a* (% change in P)
In the log-log model, a 1% change in price gives an ‘a%’ change in quantity. At any beginning price level, the same percent increase in price will lead to the same percent decrease in quantity regardless of the point on the demand curve – i.e., the price elasticity is constant.
Price Elasticity = (dQ/Q)/dP/P) = ‘a’ which is a constant equal to the slope of the log log demand curve.
Semilog model (or log-linear model): ln(Q) = aP + b d ln(Q)/dP = a d ln(Q) = a*dP dQ/Q = a*dP
% change in Q = a*(unit change in P)
In the semi-log model, a $1 change in price leads to the same % change in quantity regardless of the point on the demand curve. Price Elasticity is not constant as it depends on the Price at the point where it is measured.
Price Elasticity = (dQ/Q)/dP/P) = (a*dP)/(dP/P) = aP
In a Strategy for IT class, I had very interesting discussions with Prof. Reza Moazzami and peers about how Android’s fragmentation as a revenue source has hurt Google. I’ll write a more detailed post on how Google’s mobile strategy went south later. In this post, I would like to quickly lay out how much revenue Google might be bringing in via Android.
Per some quick brute force calculations and few assumptions (highlighted in blue), I calculated an Android contribution in 2013 of $7.21 per device per year to Google, up from a 2012 contribution of $6.18/device/yr.
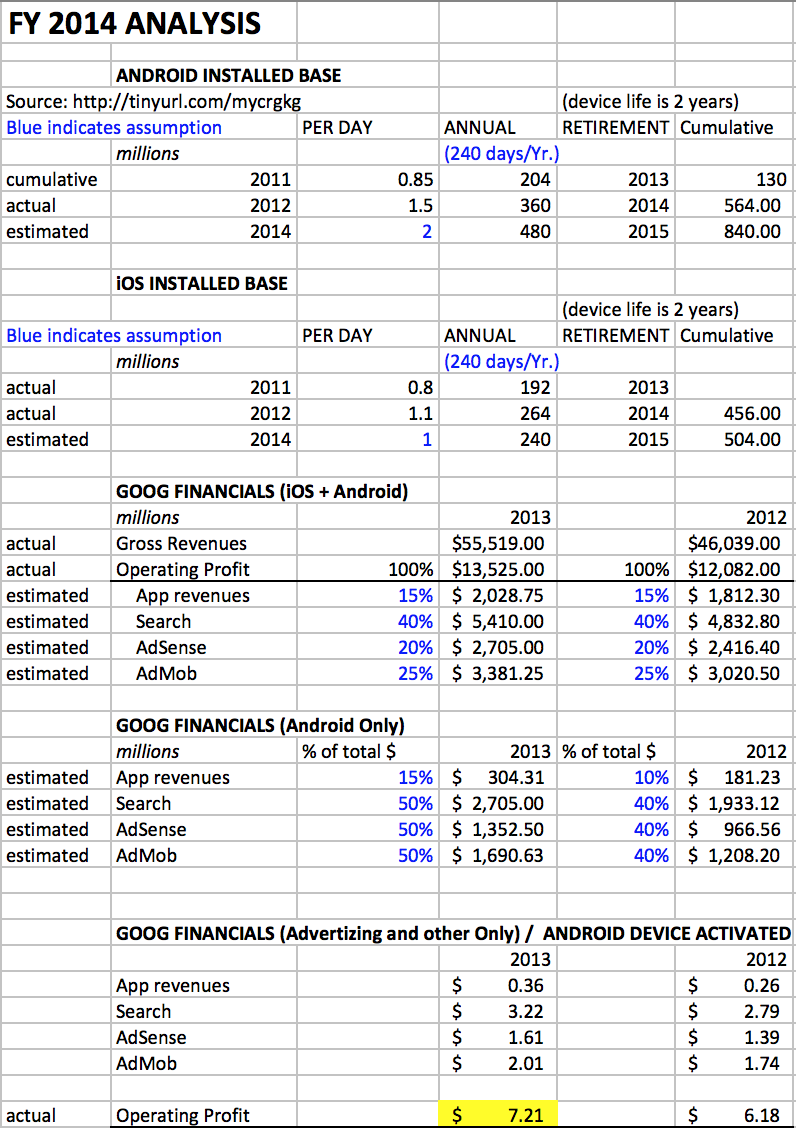
Credit should also go to the Asymco analysis at http://tinyurl.com/dyuwkwa.
